Clinical biochemistry
| Stránky: | E-learningový portál LF UK v Plzni |
| Kurz: | Indication and interpretation of laboratory results in the form of case reports |
| Kniha: | Clinical biochemistry |
| Vytiskl(a): | Nepřihlášený host |
| Datum: | neděle, 12. července 2026, 19.50 |
Popis
Basic text for clinical biochemistry.
1. Summary
- laboratory tests are indicated on the basis of clinical examination of the patient and suspicion of the disease; in asymptomatic patients only for screening purposes
- most errors that harm the patient are caused by the referring physician not thinking of a beneficial laboratory marker and not indicating it; numerically, most errors are found in the pre-analytical phase (patient preparation, sample collection and transport)
- The reference range is determined by the biological variability of the marker: it includes 95% of the values of the results in the reference population, with the lowest 2.5% and highest 2.5% of the reference population always outside the reference range.
- The decision limit is an arbitrarily determined value of a laboratory test when deciding on the presence of disease or therapeutic intervention. Diagnostic sensitivity and specificity characterize the ability of the test to separate healthy and diseased populations. Negative and positive predictive values determine the probability that a patient does or does not have the disease when the test is negative or positive, respectively.
- each laboratory result is surrounded by uncertainty and is perceived as an interval of possible values rather than a single point
- Disorders of natremia are associated with water metabolism; measurement of serum and urine osmolality and urine sodium is useful to determine the cause of hyponatremia and hypernatremia
- Disorders of kalemia are most often caused by increased loss or retention by the kidneys, or a shift between ICT and ECT (hypokalemia in alkalemia, hyperkalemia in acidemia)
- Disorders of acid-base balance are caused by causes leading to hypoventilation or hyperventilation (respiratory disorders; changes in pCO2) and disorders leading to production or loss of acids or bases (metabolic disorders; changes in HCO3, Cl-, and unmeasured anions).
- The best clinically available marker of kidney function is the estimation of glomerular filtration rate; the best clinically available marker of kidney damage is the ratio of albumin to creatinine in the urine.The chemical examination of urine by urine dipstick is one of the most indicative and very useful tests in suspected kidney disease.
- hepatocyte damage is detected by ALT values; cholestasis by ALP and liver failure by measuring prothrombin time
- in diagnosis of acute myocardial infarction the most useful of laboratory tests is cardiac troponin and the change in its concentration over time; in diagnosis heart failure we use measurement of natriuretic peptides
- CRP and procalcitonin help us to diagnose inflammatory conditions and decide on antibiotic treatment
- osmolal gap is used in acute poisoning with osmotically active substances (ethanol, methanol, ethylene glycol), in case of suspected intoxication with frequently abused substances (drugs) we indicate orientation toxicological examination of urine
2. Interpretation of laboratory data
The indication and interpretation of laboratory tests are among the daily tasks of physicians in almost all disciplines. The automation of most laboratory methods allows the determination of many markers in a short time, but only targeted indication and critical interpretation of the results can lead to benefits for the patient. In asymptomatic patients, laboratory testing is indicated rarely in screening for common and serious diseases (see below): e.g., lipidogram to determine the risk of atherosclerosis or occult bleeding in colorectal cancer screening. In other cases, the laboratory test should be indicated in a targeted manner - only on the basis of clinical examination and suspicion of a specific disease or group of diseases. Interpretation of results must be based on an understanding of the concept of reference ranges, decision limits and the clinical characteristics of the marker. Clinical use of any marker should only follow when sufficient evidence of its benefit to the patient's fate is available (evidence-based medicine, EBM).
Causes of changes in laboratory result values
The idea that the laboratory result changes only due to the disease of interest is incorrect. There are many other factors that contribute to its variability (Figure 1). Other diseases can also alter the result (the marker is not specific for the disease of interest), and considerable variance in results can be caused by biological variability.Intraindividual biological variability is variation in results in the same healthy individual - it reflects physiological regulation and adaptations.Intraindividual biological variability is the variation in marker values between healthy individuals - it reflects differences in body composition, genetic determinants, lifestyle and other factors. In addition to pathological and physiological influences, the entire information process from indication through the preanalytical phase, analytical phase, and postanalytical phase determines the value of the result and its interpretation (Figure 1).
Figure 1. Influences determining what value of the laboratory result we measure.

Let's briefly describe what happens in each phase and what errors can occur.
Indications for laboratory testing
It is based on clinical considerations about the likelihood of the disease before the test is performed and how the result may change the likelihood of diagnosis or management of the patient. The indication of an unjustifiably large number of determinations leads to an increase in the number of values that are outside the reference range (see below). For example, screening blood counts in asymptomatic patients leads to the detection of some value outside the reference range in 11% of patients: none of the patients has a serious disease, further investigation is not beneficial for the patient and unnecessarily stigmatises them and burdens the health system financially. If a physician forgets to indicate an important determination, he may not diagnose a serious disease. This is the most common error that leads to patient harm. Laboratory tests are ordered using a request form, nowadays most often in electronic form (Figure 2). All available laboratory tests and a commentary on their indication, collection and interpretation are presented by each laboratory in the form of a laboratory manual and usually available on a website.

Preanalytical phase
It includes preparation of the patient for the examination, sample collection and transport. In general, this is the stage where most mistakes are made: the patient does not follow the instructions for preparation before the examination (see below), the nurse does not correctly collect the biological material (at the right time, using the right technique, in the right and correctly labelled tube) or the sample is incorrectly transported (late arrival at the laboratory, sample degradation ...) or received in the laboratory (wrong label applied ...).
Analytical phase
It includes the actual determination of the marker; random error and systematic error contribute to the variability of the result.Random error reflects randomly distributed effects during the analytical process - e.g. random inaccuracies in pipetting sample volume and reagents, detector sensitivity, interference, etc. The most common interferents - haemolysis, ictericity and chylositivity - are routinely measured by modern analysers, so it is possible to verify the quality of the measured biological material in this way. Random error is most often expressed as imprecision - when comparing the result with the shot on the target, it is a measure of the scatter of individual shots (Figure 3).

Post-analytical phase
It mainly involves the transfer of results from the analyzer to the clinical information system: to the referring physician or directly to the patient; and the interpretation itself. During the transfer of results, there may be incorrect manual entry of results (e.g. when reporting results by telephone), confusion of units or incorrect assignment of results to another patient. Correct interpretation is always based on the clinical picture of the patient and a detailed knowledge of the correct use - advantages and disadvantages of the marker.
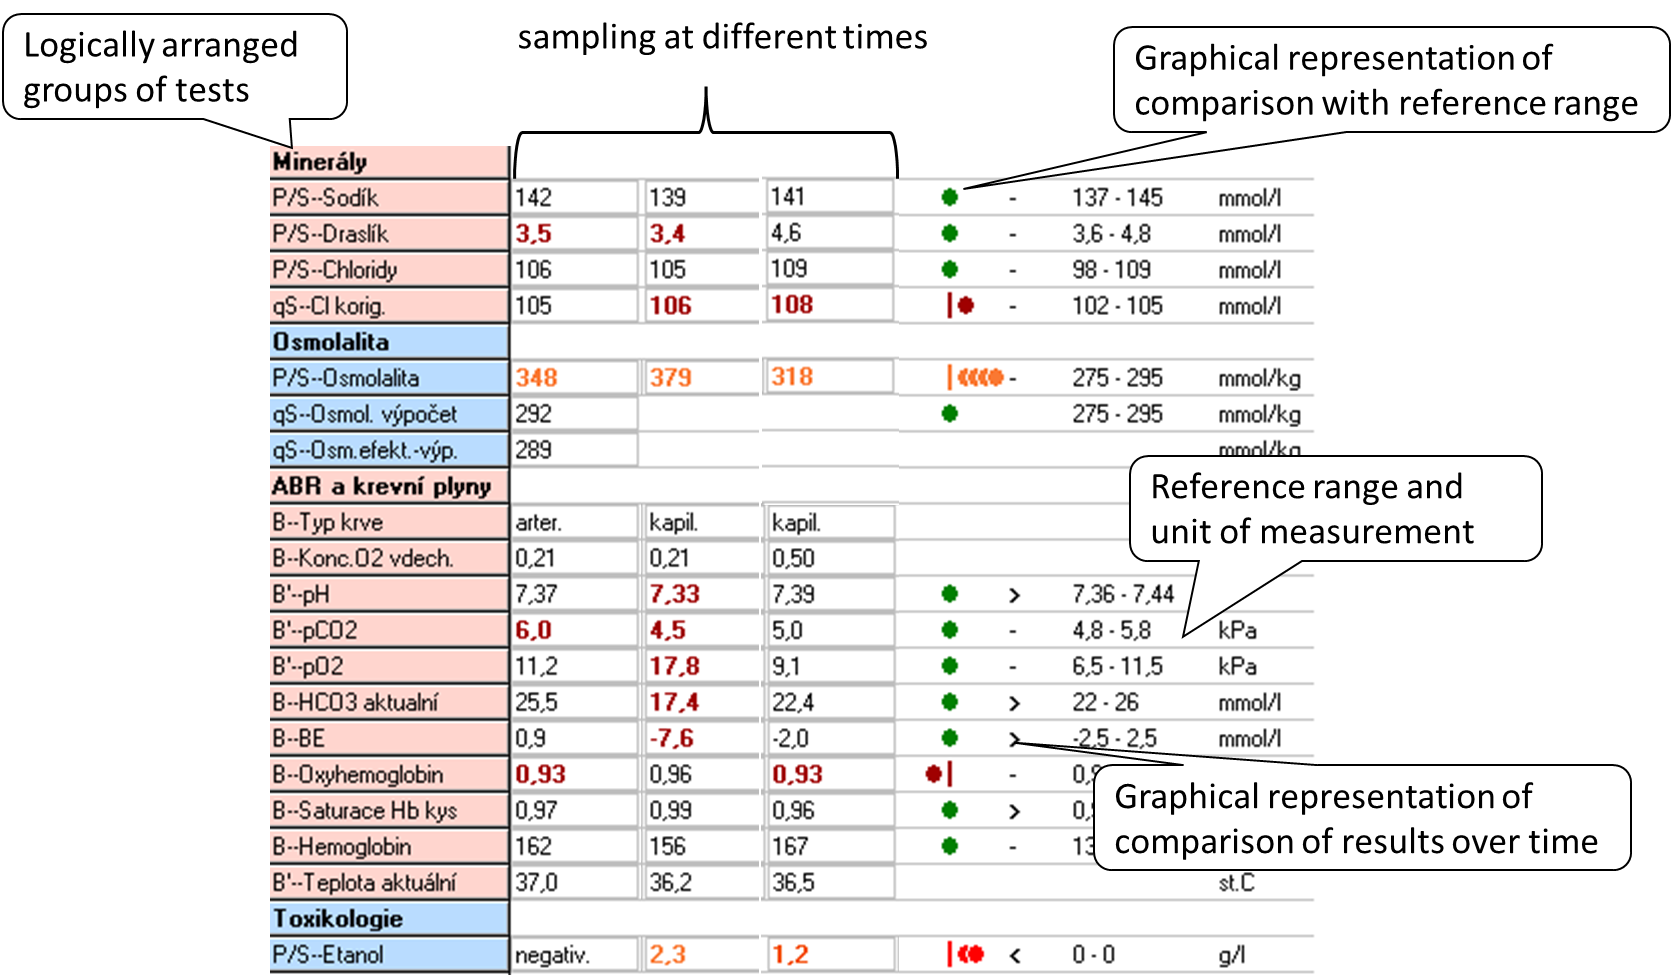
When interpreting the result, we most often use two principles: comparing the result with the reference range and comparing the evolution of the values over time.The reference range (RR) is determined by the biological variability of the marker: it includes 95% of the values of the results in the reference population, always 2.5% of the lowest and 2.5% of the highest values of the reference population are outside the reference range. Thus, in a simplistic way, we can say that 5% of the healthy population will have results outside the reference range. The reference population is composed of reference individuals who are "healthy" or at least do not have the disease that the marker affects. Health in this context can be confirmed in many ways: e.g., by questionnaire alone, by medical history, subjectively; or by physical examination, imaging, and other laboratory tests. When selecting a reference population, it is optimal to choose one that is closest to the clinical use of the marker. Figure 4 shows an example of a laboratory results sheet, including a demonstration of how the results compare to the reference range and how they have evolved over time. If the marker values are relatively stable within a single healthy individual (low intraindividual variability) and there are significant differences between healthy individuals (high interindividual variability), the reference range is relatively wide - it must cover interindividual variability. Comparison of the measured result with the RR may then not be sensitive enough to detect pathological changes in an individual and it is better to compare the evolution of values over time. Such markers are, for example, serum creatinine or cardiac troponin.
Diagnostic properties of the method, decision limit
The concept of reference range is only statistical, it is not directly related to the presence or absence of disease. Therefore, we relatively often introduce decision limits (cut-offs) - values at which we already decide, for example, to assign or exclude a diagnosis, to change treatment. When we use the decision limit for diagnosis, it divides the population under investigation into those with a positive and negative test result (Figure 5). Therefore, some patients with a positive test result will not have the disease (false positive result, FP) and some patients with a negative test result will have the disease (false negative result, FN).
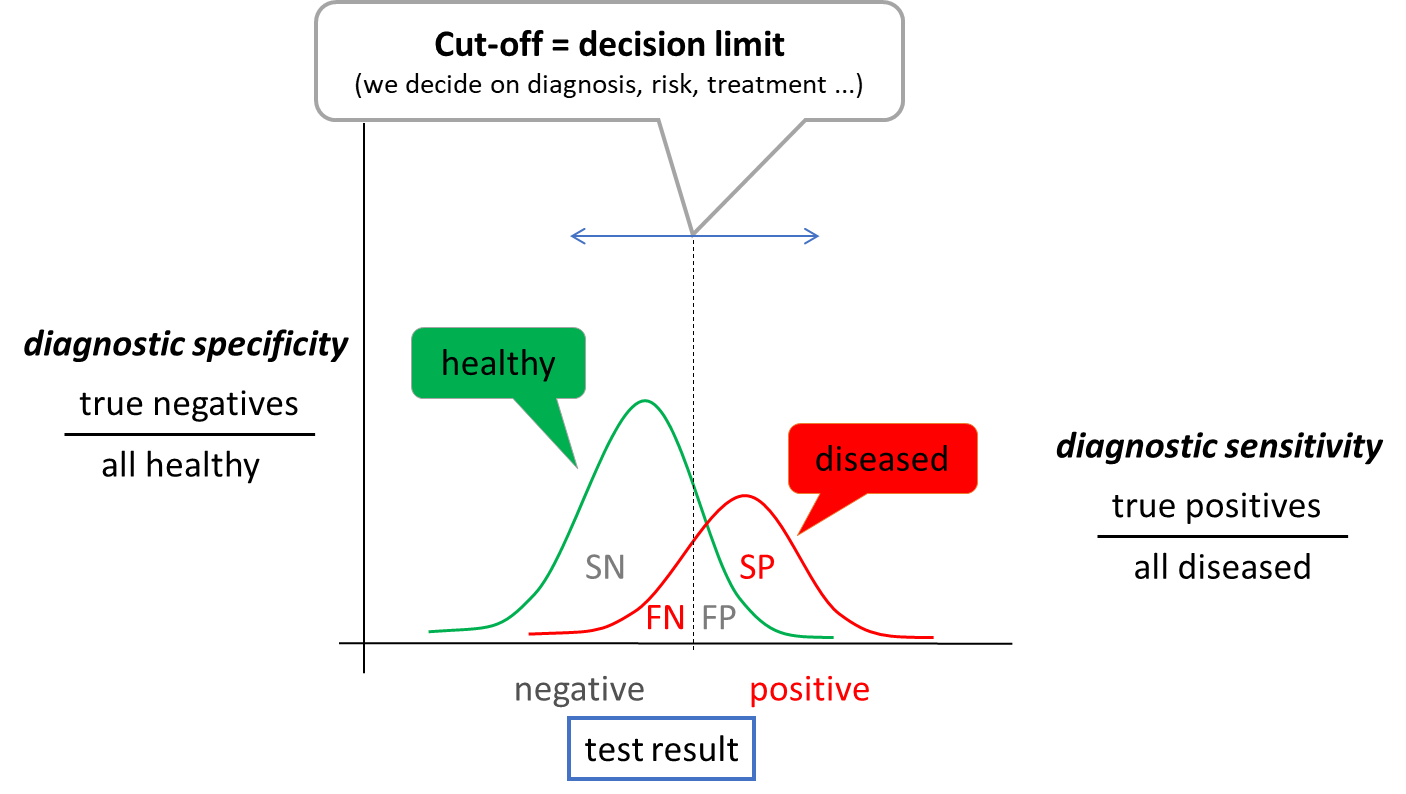
When determining the optimal cut-off value, it is useful to evaluate the ratio between the test correctly classified patients (correctly positive, SP) and all patients (SP + FN) - diagnostic sensitivity and the ratio between the test correctly classified healthy (correctly negative, SN) and all healthy (SN + FP) - diagnostic specificity. Due to the partial overlap of test result between healthy and diseased population, an increase in sensitivity always leads to a decrease in specificity and vice versa. The choice of the optimal decision limit is therefore determined by clinical needs - sometimes we prefer sensitivity: to catch all sick people, sometimes we prefer specificity: not to unnecessarily label a healthy person as sick. Diagnostic sensitivity and specificity are poorly applicable to a particular patient outcome. Therefore, we use other expressions - negative and positive predictive value (NPV and PPV). NPV is calculated as SN/all negative results and PPV as SP/all positive results. Thus, they express the probability with which the patient is healthy when the test result is negative (NPV) or with which probability the disease of interest is present when the test result is positive. For example, if we measure a very low to unmeasurable cardiac troponin value in a patient with chest pain (see below), we have a high probability that the patient does not have an acute myocardial infarction. The test has a high NPV.
Uncertainty of outcome
All of the sources of variability in the laboratory result summarized in Figure 1 lead to the necessary uncertainty surrounding the laboratory test result. This is true even when all steps are performed optimally. From this principle comes a view of comparing results over time called critical difference or also reference change value (RCV). The latter takes into account variability due to analytical imprecision and intra-individual variability, and mathematically expresses the interval within which values must fall for the variability to be due to imprecision and biological variability alone with a 95% probability. Thus, if the RCV for cardiac troponin is 50%, then if we measure a value of 100 ng/L and 120 ng/L in 12 hours, the two values are not significantly different. They would only be different if they exceeded 100 +/- 50 ng/L. The RCV principle cannot be taken absolutely, but it can help us in interpreting the results and illustrates well that the idea of a laboratory result as a single point (number) is wrong. Rather, a laboratory result is an interval of possible values, the width of which is determined by all the uncertainties surrounding it, or which we are able to quantify and account for.
Screening and selected screening programmes
In the introduction, we stated that laboratory tests are indicated only on the basis of clinical suspicion. Exceptions to this rule are screening programs, where we try to common, severe and effectively treatable diseases in the asymptomatic or oligosymptomatic stage. Depending on the set-up, we speak of population screening - we screen all individuals (e.g. over 40 years) or selective screening - we screen only individuals at risk (e.g. Screening can be done by physical examination (e.g. per rectum examination), imaging (e.g. mammography) or laboratory tests. The clinical characteristics of the screening test are individually adjusted according to the effect on the population being screened - the benefit of screening for the patient must be clearly demonstrated. Therefore, when planning any screening programme, careful consideration must be given to how many people will be included in the programme; how many of them will have the disease of interest (what is the prevalence) - how many will have a positive test result (true positive test result) and how many will have a negative test result (false negative test result); how many healthy people will have a positive test result (false positive test result); and what the next course of action will be if a positive result is found. Inappropriately chosen screening programmes can paradoxically lead to increased patient mortality - e.g. because the test itself or the subsequent management of patients with a positive result has its own risks.
As an example of population screening let us mention screening of colorectal cancer by quantitative measurement of hemoglobin in stool. All patients aged 50 years and older are enrolled - if every year for the next 5 years the test result is negative, the interval is extended to every 2 years in the following years. Alternatively, a primary colonoscopy can be performed at any time and the interval for the next test is extended to 10 years. A positive stool haemoglobin result is followed by colonoscopy. Another example is the screening for dyslipidemia, which should be considered in all individuals aged 19, 30 and 40 years; ev only in men over 40 years and in all women over 50 years and in all at-risk patients. The basic test here is LDL cholesterol. Hypothyroidism screening is an example of selective screening - we screen, for example, pregnant women in the first trimester or when there are problems with getting pregnant before conception. The test for congenital hypothyroidism is part of the newborn screening. In both cases, the basic test is the examination of thyroid stimulating hormone (TSH), if its level is elevated, we add other tests (e.g. free hormone fraction T4 ev. and T3, autoantibodies) to determine the etiology of the disease. Similarly, screening for celiac disease is selective - antibodies to transglutaminase and we only screen for total IgA in at-risk populations, e.g., patients with autoimmune diseases such as type 1 diabetes, patients with fatigue syndrome, depression, skin diseases, or unexplained ALT elevations.
Screening does not include laboratory test kits, which are usually indicated at the time of admission or at the first contact in the outpatient clinic. The use of these groups of examinations is not recommended, rather it leads to unnecessary indications and to omission of essential examinations - unless the indication is supported by critical clinical reasoning.
Blood and urine collection
Correct collection of biological material is very important for a good laboratory result. The following procedure should be followed for blood collection: (1) identify the patient and verify that the patient is properly prepared (fasting ...), (2) prepare the necessary equipment and tubes, (3) label the tube with the patient's label; it is important to perform this step in presence of the patient as a prevention of sample confusion, (4) put on gloves, (5) apply the tourniquet, (6) select the venepuncture site and disinfect it, (7) perform the venepuncture and fill the first tube, (8) release the tourniquet, (9) gently invert the tube back and forth once (mix), (10) fill the other tubes and gently invert each once, (11) remove the needle from the vein and dispose of it in the appropriate waste, (12) treat the venepuncture site and instruct the patient to apply pressure to the venepuncture site for the next 5 to 10 minutes and not to flex the arm, (13) gently invert each tube 4 more times, (14) remove gloves. Blood sampling is an activity where errors occur frequently, so it is advisable to insist on the optimal procedure and check it regularly. The most common errors associated with blood collection include haemolysis, poor tube selection and patient mix-up. Thus, we should also mention correct tube selection - each examination requires a specific type of material. The most common collection tubes include the following:
- red - without additives (or only with a clotting accelerator); provides clotting blood, which is centrifuged to obtain serum; suitable for most biochemical analyses, the disadvantage is the possible delayed clotting of the sample in the device (e.g. in anticoagulated patients)
- green - with the anti-clotting additive lithium heparinate; provides non-clotting blood, which is centrifuged to obtain plasma; used as red tubes
- purple - with the anti-clotting additive K3EDTA; provides non-clotting blood, most commonly used for blood count testing
- blue - with sodium citrate, an anti-clotting additive; provides non-clotting blood, most commonly used for testing coagulation parameters
Sampling for acid-base balance must be done anaerobically, otherwise air bubbles will affect the partial pressures O2 (rise) and CO2 (fall).
Urin is one of the easiest biological materials to obtain and its examination provides valuable information. Most errors that can completely invalidate the result of the examination are found in the way the sample is collected, its storage and failure to observe the maximum time to analysis. The following list summarises the basic types of samples used clinically:
- first morning urine - most commonly used for basic urine chemistry and urinary sediment testing. The concentration of the analytes measured is relatively high, we have the best chance of catching pathology. The disadvantage is usually the long time from collection to analysis, which leads to artifactual changes in urine composition: if urea-degrading bacteria are present, pH rises; glucose drops by bacterial decomposition; ketone bodies evaporate; bilirubin decomposes in the light; cells and cylinders break down; crystals may form and disappear. Therefore, for chemical examination and microscopic examination of urine, we usually prefer a random sample.
- second morning urine and random urine sample - both types of samples are similar in composition; for the second morning urine we only emphasize that it is the first sample produced by the kidneys in the upright position (not in sleep) and is sometimes recommended in the standardization of albuminuria testing (see below).
- short collection (e.g. 4 hours) - most commonly used for fractional excretion testing (see below). In patients without a urinary catheter, the composition corresponds to a random sample; in catheterized patients, the spout must be pinched for 4 hours.
- Collecting 24 hours - the recommended procedure is as follows:
- the patient wakes up in the morning and urinates outside the collection container
- from then on he collects all his urine in a prepared container (or more containers)
- the next morning, after waking up (exactly 24 hours later), he still urinates in the collection container
- The next step is to mix the entire volume of collected urine (if there are several containers, it is necessary to pour them into one large one), measure the volume of urine (to the nearest 100 ml) and take a representative sample.
Tests that require collection of urine (e.g. creatinine clearance) are currently being moved away from, as collection is often burdened by large errors (incomplete collection, poor mixing of the sample, inaccurate measurement of sample volume...) and is uncomfortable for patients. Therefore, if there is a relatively reliable alternative without urine collection, we prefer it.
"Non-collected" (single-use) urine samples are generally collected after careful genital cleansing as part of routine hygiene, with a midstream of urine (at least 2-3 s from the start of urination). In women during menstruation, a correct sample cannot be collected without catheterization.
For each individual urinary analyte, it is advisable to observe the time from sample collection to the actual analysis. If this cannot be met (e.g. timely transport of the sample to the laboratory cannot be ensured), preservatives can sometimes help to extend this time. The simplest and most common preservation measure is cold and darkness, i.e. refrigeration. Refrigeration will prevent significant bacterial growth for approximately 24 hours. The sample must be allowed to come to room temperature before actual analysis, otherwise the sediment may contain precipitated amorphous phosphates and urates, and increased specific gravity. Chemical preservatives are usually only suitable for one or a few analyses and may interfere with other determinations and are more likely to be used in specific applications. There are commercially available tubes which (depending on the manufacturer) can provide reliable sample preservation for up to 72 hours (at room temperature).
3. Overview of the most common laboratory tests
Laboratory determination is indicated on the basis of clinical symptoms. Clinical symptoms are rarely clearly specific for one disease, but in combination with laboratory results and imaging methods we can narrow the range of suspected pathologies or diagnose the disease. On the other hand, laboratory results are rarely specific to a single disease and laboratory evaluation without clinical context is rarely helpful. The following is a list of frequently indicated laboratory tests that can contribute to the differential diagnosis of many diseases.
3.1. Determination of Na, K, Cl
Reference range
S_Na 137 - 145 mmol/L
S_K 3,6 - 4,8 mmol/L
S_Cl 98 - 109 mmol/L
S_osmolality 275 - 295 mmol/kg
U_ osmolality (random sample) 300 - 900 mmol/kg
It is a basic test, the results of which are used for most diseases - from acid-base balance disorders to kidney and liver diseases to hormonal disorders. Sodium metabolism is closely related to water metabolism and the maintenance of an effective circulating volume. Total body water (CTV) accounts for about 70% of body weight in men and 60% in women. For example, for a 70 kg man, we assume a CTV of 49 L. Intracellular fluid (ICT) makes up 2/3 of CTV, the rest is reserved for extracellular fluid (ECT). Plasma makes up ¼ of ECT, the remaining ¾ is occupied by interstitial fluid. The composition of plasma and interstitial fluid is similar, only in the interstitial fluid proteins are almost absent (they are replaced by chlorides). The main extracellular cation is sodium, while chloride and bicarbonate predominate among the anions. The main intracellular cation is potassium, phosphate and protein predominate among the anions. Ion and water transfers between the ICT and ECT are involved in many ionic imbalances. The difference in concentrations of substances that do not freely pass between ICT and ECT is crucial for water transfers between ICT and ECT: these are cations and anions and glucose. These substances determine the so-called effective osmolality of the ECT, and we estimate it as 2 x Na+ + glucose (we multiply the concentration of Na+ by 2 to include the corresponding anions - e.g. Cl- and HCO3-). In contrast, substances such as urea or ethanol pass freely between ICT and ECT - changes in their concentration do not lead to water shifts.
The major system that regulates

ADH is produced in the hypothalamus and secretion is primarily controlled by plasma osmolality, which is detected by osmoreceptors in the hypothalamus. As the effective plasma osmolality increases, ADH secretion increases - the body attempts to compensate for the high plasma osmolality by greater renal water absorption. However, there are also non-osmotic stimuli to increase ADH production - e.g. hypovolaemia, nausea and vomiting, some drugs. These may be important in the pathophysiology of e.g. hyponatremia. The recruitment of ADH to V2 receptors in the collecting duct of the nephron results in the "opening" of water channels (aquaporins) and increased water absorption.
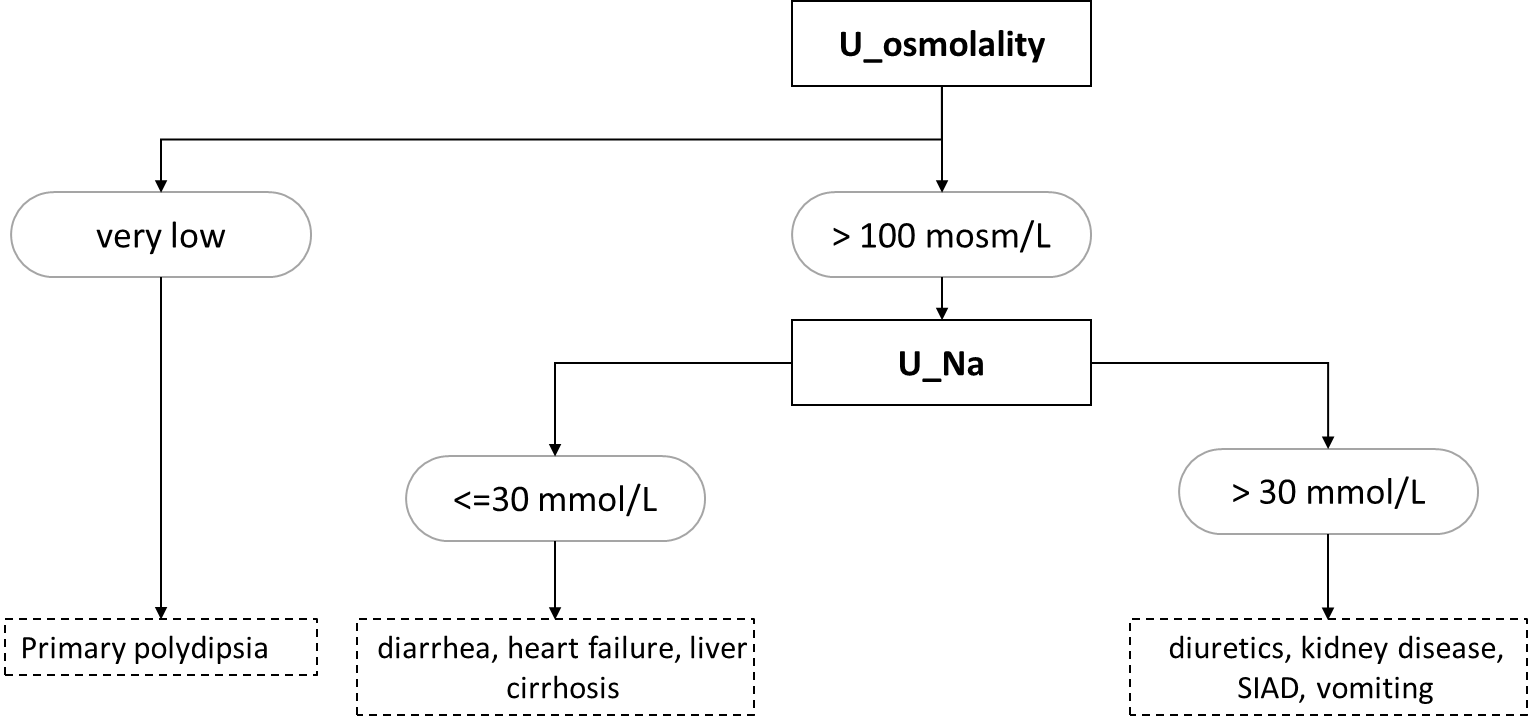
Hyponatremia is a blood sodium concentration below 135 mmol/L. Most often, the osmolality is also adequately reduced (hypoosmolar hyponatremia). However, the cause is renal (e.g., administration of thiazide diuretics) or extrarenal (e.g., GIT secretions or sweating) loss of sodium, often as a result of hypoosmolar fluid loss -> increased ADH secretion due to hypovolaemia -> water replenishment by drinking and relative excess water. Adjunct hyponatremia is the cause of primary polydipsia (water intoxication). The high osmolality in hyponatremia (hyperosmolar hyponatremia) is found especially in hyperglycemia, e.g., in a decompensated diabetic patient - high glucose concentration in ECT will lead to transfer of water from ICT to ECT and consequent dilution of Na+ concentration in plasma. If hyponatremia is accompanied by normal serum osmolality, this is an error in sodium determination - high dilution during Na+ determination with ion-selective electrodes on automated analyzers will cause falsely low Na+ concentrations in samples with extremely elevated lipid (chylose serum) or protein (e.g., multiple myeloma) concentrations. The basic laboratory diagnostic approach to hypoosmolar hyponatremia is based on urine osmolality and sodium values (Figure 7).
Hypernatremia is a blood sodium concentration above 145 mmol/L. It is most often caused by loss of pure water or hypoosmolar fluid that is not replenished by drinking. This includes bedridden patients who, for example, lose fluids during fever or polyuria and cannot replenish them by drinking without the help of nursing staff. Alternatively, self-sufficient patients who do not have access to drinking water. The basic diagnostic approach to causes of hypernatremia is based on measurement of urine osmolality - if very low (below 300 mosm/kg), the cause of hypernatremia is diabetes insipidus; if very high (above 600 mosm/kg), the cause is thirst or fluid loss through the gastrointestinal tract or sweat.
Hypokalemia is a concentration of potassium in the blood below 3 mmol/L. The most common causes are loss through the gastrointestinal tract by vomiting or diarrhea, administration of crank diuretics, primary hyperaldosteronism, and alkalemia. Alkalemia leads to transfer of K+ into cells, whereas acidemia leads to transfer of K+ out of cells. In extrarenal losses, the concentration of K+ in urine is very low.
Hyperkalemia is a concentration of potassium in the blood above 5 mmol/L. The most common causes are reduced renal excretion in renal failure (see below) or administration of hyperkalemic therapy and transfer of K+ from the ICT in acidemia. Examples of hyperkalemic drugs include ACEIs, ARBs, potassium-sparing diuretics (spironolactone, triamterene).
The assessment of chloride concentration in the blood is essential for the interpretation of the acid-base balance and will be discussed there.
3.2. Introduction to acid-base balance disorders
Reference range
pH 7.36 - 7.44
pCO2 4,8 - 5,8 kPa
HCO3- 22 - 26 mmol/L
BE -2.5 - 2.5 mmol/L
AG 14 - 18 mmol/L
The homeostasis of hydrogen ions is essential for the maintenance of optimal enzyme function and protein ionization; significant changes in the concentration of H+ bind e.g. active cellular transporters (e.g. Na+/K+ ATPase) and energy production (enzymes of glycolysis and lipolysis). The terms acidemia and alkalemia are used for increased and decreased H+ concentrations, respectively. For acid-base balance (ABR) disorders, the term alkalosis a acidosis is reserved, which reflects the whole pathophysiological process with its cause and compensation, in addition to the H+ concentration itself. The organism tries to maintain the optimal concentration of H+ in the following ways:
- buffers - generally they are salts of weak acids, which can bind H+ in case of acidemia, and release H+ in case of alkalemia. The most important buffer of ECT is hydrogen carbonate (HCO3-); in ICT, the most abundant is phosphate, proteinate and in erythrocyte hemoglobin. At elevated H+ loading, buffering is distributed between ICT and ECT with a slight predominance of buffering capacity in the ICT. These are fast reactions (on the order of seconds), but can take up to hours to propagate between ICT and ECT.
- Organ Compensation - the most important organs that compensate for ABR disorders are the kidneys and lungs. The kidneys compensate for excess H+ in acidosis by excreting H+ and Cl- in the urine and by newly formed HCO3-. Most of the H+ is excreted by urinary buffers: phosphate and ammonium. Ammonium buffer is more significant in compensations, it can increase its excretion capacity considerably (5 times). The principle of this compensation is a gradual (over 3 to 5 days) increase in ammonia production from glutamine in cells of the proximal tubule. Ammonia is then excreted in the form of ammonium chloride in the urine. Or in the case of acidosis caused by one of the non-resorbable acids - e.g. ketoacidosis or acidosis in ethylene glycol poisoning - the ammonium cation binds to the anion of the corresponding acid. Adaptation of the kidney to alkalosis is much less effective or counterproductive. The most common causes of metabolic alkalosis (vomiting and diuretics) lead to activation of the RAAS, to hypochloremia and intracellular acidosis. RAAS activation causes Na+ absorption, with which HCO3- is partially absorbed. Hypochloremia prevents the excretion of HCO3- by the passive tubular antiport HCO3-/Cl-. Compensatory hypoventilation leads to hypercapnia, which causes intracellular acidosis to which tubular cells respond by secreting H+. These compensatory events in the most common causes of metabolic alkalosis thus result in paradoxical further secretion of H+ and retention of HCO3-. The lungs compensate for metabolic acidosis by hyperventilation = lowering the partial pressure of CO2 (pCO2) in the blood and for metabolic alkalosis by hypoventilation = increasing the pCO2 in the blood. However, hypoventilation is limited by hypoxia and is not very effective.
The essential laboratory parameters for the assessment of ABR in blood are H+, pCO2, Na+, K+, Cl-. We traditionally express H+ as the negative decadic logarithm of the activity of H+, pH. It is therefore a logarithmic scale to which we are not normally accustomed, and we have to reckon with the fact that a small numerical change means a large change in concentration. From H+ and pCO2 we calculate HCO3using the relationship:
It is also clear that the resulting concentration of H+ depends on the ratio between H2CO3 and HCO3-, not on their absolute concentration. The concentration of H2CO3 corresponds to pCO2, in the above relation we can use pCO2 after conversion by the solubility coefficient.
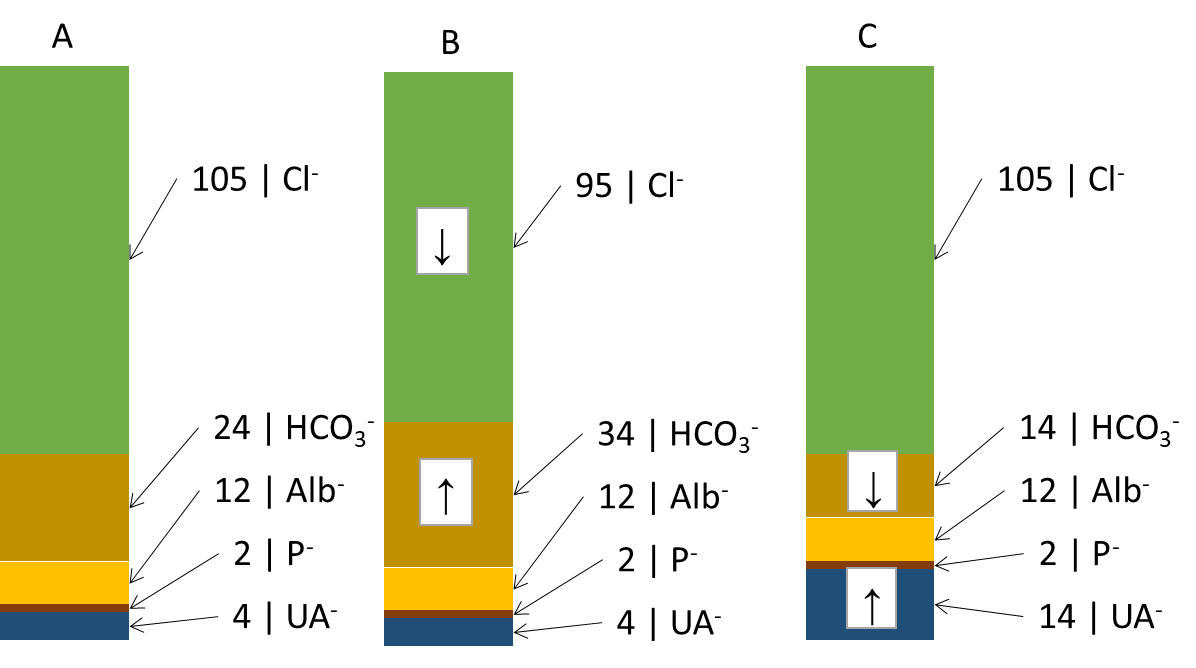
Another useful derived relationship is thebase excess extracellular fluid (BEECT). It is a parameter defined simplistically as the amount of strong acid that must be added to the model fluid corresponding to the ECT to return the pH to normal (assuming pCO2 is normal). BE attempts to summarize the effect of the non-respiratory component (bicarbonate and other buffers - mainly hemoglobin) on ABR. Changes in the concentration of hemoglobin are rather negligible from the point of view of buffering capacity, BEECT thus practically expresses changes in HCO3- caused by metabolic (non-respiratory) influences. Negative values indicate an excess of acids - metabolic acidosis, positive values a deficiency of acids - metabolic alkalosis. However, BEECT does not inform us in any way about the cause of the metabolic disorder and is a summative reflection of all metabolic influences: we therefore do not detect combined disorders. These shortcomings are improved by electroneutrality theory, which very simplistically states that the sum of all positive and negative charges in the ICT and ECT is zero. Thus, there is an equal number of anions and cations. Therefore, for example, an increase in one anion must lead to a decrease in another or an increase in a cation. We are most interested in the anion column, where we find the main determinants of the ABR state: chloride, bicarbonate and unmeasured anions. In Figure ... we see (A) normal anion concentrations in plasma, (B) an example where the patient loses chloride - by vomiting or after administration of furosemide; another anion - HCO3- (provided by the kidneys and other mechanisms) - must rise to compensate. If the production of relatively strong acids, such as β-hydroxybutyric acid or lactic acid (C), rises, the increased H+ load is buffered by HCO3- (and other buffers) and the concentration of HCO3-decreases. However, the situation in Figure ... is very simplistic - the H+ load is distributed between ICT and ECT, and the effect on the decrease in HCO3- and BEECT may not be exactly 1:1. In any case, once equilibrium is established, the equilibration of the ratios between ICT and ECT reflects BEECT all relevant metabolic (non-respiratory) influences. Chloride on the one hand and unmeasured anions on the other hand determine the magnitude and direction of BEECT; if we find the cause of the change in Cl- and unmeasured anions, we also reveal the cause of the ABR disturbance.
In Figure 8 we did not account for changes in cations. These are also important for ABR, especially changes in Na+ relative to changes in Cl-. If both ions change proportionally, there is no reason to change the concentration of HCO3-. If, however, Cl-
Clcor = Cl- x 140/Na+
Unmeasured anions are simplified by the calculation of the anion gap (AG)
AG = (Na+ + K+) - (HCO3- + Cl-)
The formula does not take into account some plasma cations (Ca2+, Mg2+) and anions (albumin charge, phosphate charge, unmeasured anions) in the plasma and expresses just their difference (12 + 2 + 4 on the side of anions see Figure 8 and subtract 1.5 + 1.5 for unmeasured cations, the result is 15 mmol/L). In unmeasured anions we count ketoacid anions in ketoacidosis, lactate in lactic acidosis, or acid anions formed during the metabolism of ethylene glycol (oxalate), ethanol (acetate), and methanol (formate) or salicylate. As mentioned above, unmeasured anions are, together with chloride, the main factors determining the concentration of HCO3- in plasma. Thus, AG reveals important causes of metabolic acidosis. It is also clear that most AG is physiologically albumin - with significant changes in albumin concentration, the AG calculation may be biased and may not reveal the presence of unmeasured anions. It is therefore advisable to correct the AG for the actual albumin concentration. We start from the simplified assumption that the albumin charge in ¼ mmol/L corresponds to ¼ of the albumin concentration in ¼ g/L. Thus, if albumin drops from 40 g/L to 20 g/L, the albumin charge drops from 10 mmol/L to 5 mmol/L.
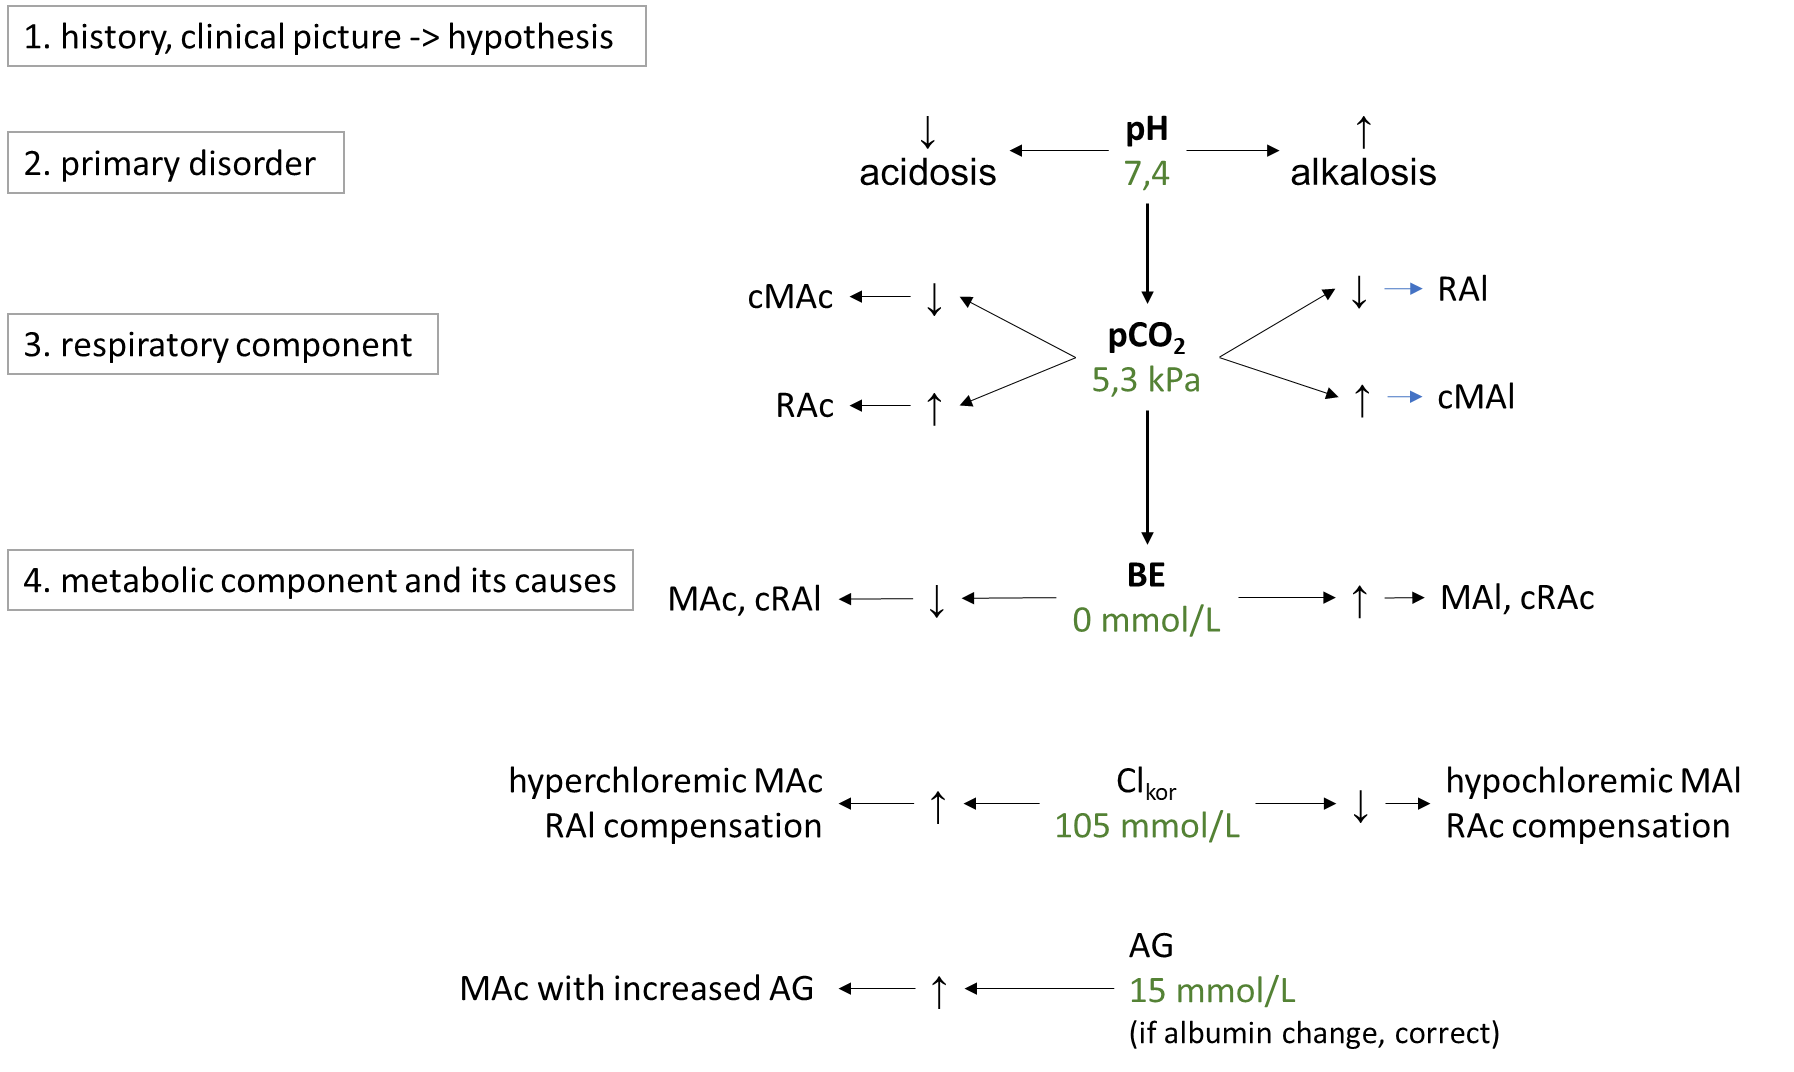
ABR disorders are divided into respiratory and metabolic disorders.Respiratory disorders are primarily caused by hyperventilation (respiratory alkalosis, low pCO2; RAl) or hypoventilation (respiratory acidosis, high pCO2; RAc).The cause of RAl is e.g. hyperventilation during emotional tension, pain, discomfort, in the early stages of hypoxia, in sepsis or irritation of the respiratory centre by salicylates or in CNS pathology. Causes of RAc include respiratory failure, chronic obstructive bronchopulmonary disease, or pharmacologic attenuation of the respiratory center by opiates. Metabolic disorders are primarily usually caused by changes in chloride and in unmeasured anions, which are reflected in bicarbonate concentrations. In simple terms, the metabolic component is expressed by BEECT - low indicates metabolic acidosis, MAc, high metabolic alkalosis, MAl. The cause of MAc may be e.g. A rise in chloride (hyperchloremic MAc) after saline administration, in diarrhea (losses of HCO3- through diarrhea are replaced in the anion column by chloride), or in ureterosigmoidostomy (in the colon, Cl- is absorbed from the urine). Another group of causes of MAc are acidosis due to increased production of organic acids in ketoacidosis, lactic acidosis, ethanol, methanol, ethylene glycol or salicylates and paracetamol poisoning. All of these acidoses are caused by an increase in unmeasured anions, so they are acidoses with increased AG (normochloremic). The most common cause of MAl is loss of chloride during vomiting or during administration of furosemide (hypochloremic MAl) ev. MAl caused by increased mineralocorticoid exposure or severe hypokalemia. A basic overview of how to approach the evaluation of ABR disorders is shown in Figure 9. First, we estimate the likelihood of the presence of ABR based on the history and clinical status and hypothesize what disorders come into consideration in the case. Then, in successive steps, we evaluate laboratory parameters: pH to determine the primary ABR-> disorder; pCO2 to elucidate the influence of the respiratory component, and finally BEECT to determine the summary metabolic component. For the metabolic component, we then determine the influence of corrected chloride and AG.
Figure 9. Basic diagnostic approach to ABR disorders. More detailed description intext.
3.3. Kidney disease
Reference range
S_creatinine men: 62 - 106 mmol/L; women: 44 - 80 mmol/L
S_Urea 2,5 - 8 mmol/L
U_ACR < 3 g/mol creatinine
U_erythrocytes < 15/µL
U_leukocytes < 20/µL
Chronic kidney disease affects up to 10% of the population; acute kidney injury is often encountered in hospitalised patients, especially in intensive care units. Laboratory tests can reveal both damage to the renal parenchyma and changes in renal function: glomerular filtration rate and tubular function. The basic methods that we use to detect kidney disease are summarized in Figure ... In the first line, we obtain indicative information from chemical urine strip test - every patient with suspected kidney disease should have. It is usually a set of several (often ten) parameters that are measured on individual fields of a plastic strip. After reaction with the relevant substances present in the urine, the detection fields are coloured and read by eye or instrumentation. It is essential to remember that this is a landmark test, to evaluate it in the context of clinical signs and other investigations, and to think about the most common causes of false positive and false negative results:
- Detection of glucose and blood is based on oxidation - FP results are caused by oxidizing agents (e.g., disinfectants from an improperly treated collection container), FN results are caused by reducing agents (e.g., vitamin C). The principle of glucose determination is the enzymatic breakdown of glucose to form hydrogen peroxide, which oxidizes the detection dye. The principle of blood determination is the pseudoperoxidase activity of heme - it is able to oxidize the detection dye in the presence of H2O2. If we realize that heme is detected, it is not surprising to find positive blood in urine even in myoglobinuria (muscle damage) or hemoglobinuria (intravascular hemolysis)
- Detection of protein is based on the acid-base indicator - negatively charged albumin can pull H+ out of the acid-base indicator and thus cause discoloration. The buffer in the detection field ensures that the colour of the indicator does not change in dependence on changes in urine pH. However, when the buffer capacity is exceeded at high pH values ( 8), discoloration can occur even in the absence of albumin - FP result. H+ only negatively charged proteins (mainly albumin) can be removed from the indicator; other proteins (e.g. myoglobin, Bence-Jones protein) will not be sensitively detected (FN results);
Microscopic examination and quantitative urinalysis further refine the information as needed. Measurement of creatinine and cystatin C in serum is used to estimate glomerular filtration rate.

Glomerular filtration rate(GFR) is the amount of plasma filtered by the glomerulus per unit time. It is expressed in ml/s. Decrease in GFR accompanies a variety of diseases and regardless of the cause, it is a summary parameter that gives a good indication of renal function. The GFR data are used, for example, to change the dosage of drugs excreted by the kidneys, for the application of radiographic contrast agents, and for the classification of chronic renal insufficiency. In clinical practice, we do not routinely have methods for accurate measurement of GFR (inulin clearance, iothalamate, radioisotope methods), so we use estimates (estimated GFR, eGFR):
- serum creatinine and calculations derived from it - creatinine is formed in muscles from creatine and phosphate. It is a small molecule that is freely filtered by the glomerulus. Concentration in serum therefore inversely reflects GFR; the largest non-glomerular influence on creatinine levels in serum is muscle mass. Its physiological changes due to age (muscle mass decreases with age), sex (men have more muscle mass than women) are reflected in calculations such as the CKD-EPI equation. However, if there are other factors affecting muscle mass, e.g. patient immobilization, catabolic states, malnutrition, eGFR using serum creatinine will not work well.
- serum cystatin C and calculations derived from it - cystatin C is formed at a relatively constant rate in each nuclear cell. It is a microprotein that is freely filtered by the glomerulus. It is then picked up and degraded in the proximal tubule. Thus, the concentration of cystatin C reflects inversely proportional glomerular filtration rate, and modern equations for estimating glomerular filtration rate have a version for cystatin C (e.g., the CKD-EPI equation). eGFR based on cystatin C is applicable in pregnant children or as a confirmatory estimate of GFR from serum creatinine. Corticotherapy or hyperthyroidism may increase cystatin C production and thus affect the eGFR derived from it.
- Creatinine clearance - as mentioned above, creatinine freely penetrates the glomerular sieve, but is partially secreted in the tubules - the higher the creatinine concentration in the serum, the greater the secretion in the tubules. We use the formula (urine creatinine concentration x urine volume in 24 hours)/serum creatinine concentration. Secretion into the tubules will increase the concentration in the urine - the higher the creatinine in the serum, the more the clearance overestimates. However, the biggest limit to the use of creatinine clearance is the 24-hour urine collection. This is a task that is demanding for the patient and errors are very common: incomplete collection, inaccurate measurement or just an estimate of the volume of urine collected (should be to the nearest 100 ml).
Tubular functions include acidification ev. alkalinization of urine, resorption and secretion and concentration capacity of the kidneys. A rough reflection of the acidifying capacity of the kidney is the pH of the urine, especially after acid load. The concentrations of ions in the urine or their fractional excretion are used as indicators of resorption and secretion. Concentration capacity of the kidney is monitored by urine osmolality (specific gravity). Water absorption in the distal tubule is mainly controlled by ADH - its production increases with increased plasma osmolality (osmoreceptors in the hypothalamus) and stimulation of carotid baroreceptors by hypotension. The effect of ADH is to open the channels for water - aquaporins in the collecting ducts of the kidneys. If the renal medulla is sufficiently hyperosmolar, passively, along a concentration gradient, water is absorbed => the concentration (specific gravity, osmolality) of urine rises. The hyperosmolality of the marrow is produced by, among other things, the absorption of Na, K and Cl without water in Henle's loop. The disruption of marrow hyperosmolality is the basis for the effect of furosemide, which blocks Na, K, 2 Cl cotransport in the Henle's villus. The marrow is not hyperosmolar and we lose Na, K, Cl in the urine. Na is partially absorbed due to RAAS activation (furosemide is usually given in conditions with secondary hyperaldosteronism), but water is not much absorbed in the collecting ducts even when the aquaporins are open (ADH effect) because the marrow is not hyperosmolar. The result is then a loss of water and a relative conservation of Na.
The indicators of renal damage include mainly proteinuria and haematuria, or the presence of renal tubular cells and granular cylinders in the urine microscopic examination.
Laboratory markers help us to distinguish between renal failurewithout renal parenchymal damage (functional, formerly called prerenal) andwith renal parenchymal damage (renal). In functional failure, we assume full restitution of renal function after adequate treatment - an example is renal failure in dehydration. Typically, we find no evidence of renal damage and tubular function shows effective adaptation - urine specific gravity/osmolality is markedly elevated (water retention in dehydration), urine sodium concentration is low (RAAS activation and adequate tubular response). In renal failure (e.g., damage from toxic drugs, ethylene glycol poisoning, glomerulonephritis), loss of renal function may be permanent. Typically, we find some signs of renal damage - proteinuria (albuminuria), hematuria, renal tubular cells, granular cylinders, and tubular function tends to be impaired. However, there is no specific marker to differentiate and we rely on complex information. The distinction is arbitrary and both renal failures may not initially show signs of renal damage - these only appear in the later course.
To diagnose chronic kidney disease, we use a combination of eGFR and albuminuria - usually expressed as albumin creatinine ratio (ACR). We make the diagnosis if we find eGFR less than 1 ml/s or kidney damage (detected e.g. by ACR or haematuria) and eGFR < 1.5 ml/s at least twice in 3 months. We determine the stage of chronic kidney disease according to the degree of decrease in eGFR and increase in ACR (KDIGO classification).
For the diagnosis of acute renal failure, the CKD-EPI classification is based on changes in serum creatinine (rise in comparison with basal creatinine) and urine production.
3.4. Liver disease
Reference range
S_ALT males: < 1 µkat/L; females: < 0.7 µkat/L
S_AST males: < 0.8 µkat/L; females: < 0.6 µkat/L
S_ALP > 2,2 µkat/L
S_GGT males: < 1.9 µkat/L; females: < 1.3 µkat/L
S_bilirubin (total) < 25 µkat/L
S_albumin 35 - 50 g/L
Laboratory examination can help in detecting hepatocyte damage, the presence of cholestasis and in testing liver function and its ev. failure. A sovereign test for detecting hepatocyte damage alanine aminotransferase (ALT). It is a cytoplasmic enzyme that is released even with mild damage to the hepatocyte. It is relatively specific for liver tissue. In special cases, the activity of aspartate aminotransferase (AST) can also help us a mitochondrial enzyme that is released only in more severe damage to the hepatocyte, in its necrosis. The disadvantage is considerable tissue nonspecificity - it is also found in high concentrations in skeletal muscle and myocardium. The AST/ALT ratio is sometimes used - high is found in necrosis of the hepatocyte and in alcoholic liver disease. Alcohol along with non-alcoholic fatty liver disease (NAFLD) and viral hepatitis are among the most common liver diseases.
For the detection of cholestasis alkaline phosphatase (ALP) - an enzyme abundantly found in the cytoplasmic membrane of the biliary lining, but also in the bones, placenta and intestine. The enzyme gammaglutamyltransferase (GGT) helps in distinguishing whether an increase in ALP is of hepatic origin - if both are elevated, ALP is probably of hepatic origin. GGT measurement alone is of little clinical significance; it rises both in cholestasis and with excessive ethanol consumption, as well as induction by many drugs. ALP activity does not distinguish whether the obstruction is intra or extrahepatic, for this requires imaging (usually ultrasound). The most common cause of extrahepatic cholestasis is cholelithiasis or tumour (e.g. pancreatic). Intrahepatic cholestasis is often related to e.g. drug administration, and occurs in autoimmune diseases.
Hyperbilirubinemias occur when there is an imbalance between bilirubin production and its breakdown. Bilirubin is produced in the reticuloendothelial system by the breakdown of heme from erythrocytes, myoglobin and other hemoproteins. Subsequently, this lipophilic unconjugated bilirubin is transported bound to albumin to the liver. Here it is taken up and conjugated by the enzyme UDP-glucuronyltransferase and then excreted by active transport into the bile. Increased hydrophilic conjugated bilirubin freely passes into the urine, in contrast to unconjugated - bound to albumin.
Of the many liver functions we are trying to capture in the laboratory the failure of the following: bilirubin metabolism (impaired uptake, conjugation and excretion), proteosynthesis and possibly also urea synthesis + ammonia degradation. Acute changes in proteosynthesis can be detected by measuring a simple coagulation test: prothrombin time (PT) - reflects the synthesis of coagulation factors = proteins often with short half-life (several hours). Measurement of the concentration of albumin in serum is of rather prognostic importance due to its long half-life (about 20 hours) and considerable reserves.Hyperbilirubinemia as a marker of hepatic failure occurs as a consequence of hepatocellular injury, therefore in these cases it is always found together with elevated ALT, and possibly ALP and other enzymes. The cause of hyperbilirubinemia here is failure first of excretion of conjugated bilirubin into bile (the most demanding, ATP-dependent step of bilirubin metabolism), and later of the ability of the hepatocyte to uptake and conjugate bilirubin.Elevated ammonia levels in the blood may result from increased ammonia production (e.g., in the intestine during GIT bleeding) or from impaired incorporation of ammonia into urea (one of the liver's functions). Hyperammonaemia can also be considered a sign of liver failure, but e.g. it does not correlate well with the degree of hepatic encephalopathy and is rather of prognostic significance.
3.5. Signs of damage to the heart and skeletal muscle
Reference range
S_TnT (99th percentile of reference population) 14 ng/L
S_NT-proBNP < 125 ng/L
S_BNP < 100 ng/L
CK males: < 3,2 µkat/L; females: < 2,4 µkat/L
Myoglobin males: 28 - 72 µg/L; females: 28 - 58 µg/L
D-dimers < 0,5 mg/L FEU
For the diagnosis of structural myocardial damage, we mainly use cardiac troponins (cTn). These are proteins that are part of the contractile apparatus of the muscle. Cardiac troponin T (cTnT) and cardiac troponin I (cTnI) are sufficiently different in skeletal and cardiac muscle - we can reliably distinguish them analytically, so they are markers specific for cardiac muscle. We consider acute myocardial injury to be an increase in cTn above the 99th percentile of the reference population and a dynamic change in cTn values greater than 20% (increase or decrease). If signs of myocardial ischemia - e.g. ECG or clinical - are added to acute myocardial injury, it is acute myocardial infarction (AIM). Clinically, more complex algorithms are used, usually introducing two limits for absolute values and two limits for changes over time. One combination of absolute value and change is for exclusion of AIM, the other combination is for inclusion in AIM. cTn in this arrangement have a high NPV but a worse PPV (see above). However, acute myocardial injury itself is also found in other cardiac diseases, e.g. myocarditis or toxic myocardial injury.
We have mentioned above that during volume overload of the ventricles, brain natriuretic peptide type B (BNP) and a cleft of its precursor, N-terminal propeptide of natriuretic peptide type B (NT proBNP), are produced.Both are used as markers of heart failure and are incorporated into clinical diagnostic algorithms for the diagnosis of heart failure.
Skeletal muscle damage is best determined by an increase in the activity of the enzyme creatine kinase (CK). This is mainly a cytoplasmic enzyme composed of two subunits, M (muscle) and/or B (brain). Different isoenzymes contain different combinations of subunits: MM (predominant in skeletal muscle), MB (predominant in cardiac muscle) and BB (predominant in brain). The determination of CK isoenzymes is no longer used clinically, nor is the determination of CK-MB for the diagnosis of AIM. Total CK activity is useful for the diagnosis of skeletal muscle damage as well as for monitoring progress and treatment monitoring. Among the causes of rhabdomyolysis are excessive physical stress, convulsions, trauma, multi-organ failure (e.g. in sepsis), alcohol and some drugs (cocaine). Myoglobin is a relatively small muscle protein that is also released when striated muscle is damaged. Most of it is excreted by the kidneys, so a decrease in glomerular filtration rate increases its levels. Because it passes into the urine, it causes a positive blood result on an indicative test strip blood chemistry test (see above). Measurement of myoglobin levels is no longer relevant in the diagnosis of AIM, and even for the detection of rhabdomyolysis, CK is preferable due to its independence of GFR. The only advantage of myoglobin is its short half-life, so it can respond very quickly to changes.
D-dimers are formed by fibrin degradation and are used as a marker of thromboembolic conditions (e.g. deep vein thrombosis, pulmonary embolism). Their high NPV is valuable - if they are negative, the probability of the presence of disease is low. However, they also rise in a range of other conditions - e.g. in pregnancy or inflammation. A positive result is therefore of little predictive value.
3.6. Diagnosis of inflammatory conditions
Reference range
S_CRP < 8mg/L
S_PCT < 0,1 µg/L
Laboratory markers of inflammatory conditions are based on the production of effectors in response to the pathogen. In addition to blood counts (leukocytosis, neutrophilic granulocytes, left shift), we most commonly use the determination of C-reactive protein (CRP) and procalcitonin (PCT). Both respond to the presence of Pathogen Associated Molecular Patterns (PAMPs), which are recognized by macrophages. In response to this stimulus, macrophages trigger, among other things, the synthesis of interleukin 6 (Il-6) - which stimulates the synthesis of PCT in many tissues (but mainly in the liver) and CRP in the liver and adipocytes. The advantage of PCT over CRP is a slightly earlier rise and a more pronounced response to the retreat of infection. CRP rises in bacterial as well as viral (less), mycotic, allergic and autoimmune inflammation. The decision point for distinguishing between viral and bacterial inflammation is around 50 mg/L. CRP is also a general marker of tissue breakdown - it rises after surgery, trauma, in tumors. PCT is slightly more specific for bacterial and mycotic inflammation, and among non-infectious increases, name severe burns, severe trauma, major surgery, and multi-organ failure. We consider values of < 0.5 µg/L to be low; values at 2 µg/L can be used as an aid in the diagnosis of sepsis. PCT is a useful biomarker to help in the decision to deploy and withdraw antibiotic therapy.
3.7. Basic toxicological examination
Reference range:
OG < 10 mmol/L
The role of the laboratory in suspected poisoning by a toxic substance is irreplaceable. In the case of oral intoxication, it is necessary to take into account the time required for the absorption of the noxious substance - it appears in the blood and later in the urine. In special toxicological indications, especially in chronic poisoning) we also use less common biological materials such as hair and nails.
The most frequently encountered cases are acute ethanol poisoning and massively active substances in general. This is where the calculation of the osmolal gap (OG) - the difference between the measured and calculated osmolality-helps us. The calculated osmolality expresses the expected osmolality formed by endogenous substances and is calculated as 2 x Na + urea + glucose (see also above Determination of Na, K, Cl). Subtracting it from the instrument-determined - real osmolality of the patient gives the difference, which contains just exogenous osmotically active substances such as ethanol, methanol or ethylene glycol. The ethanol level is determined acutely by most laboratories - we can estimate the contribution of ethanol to OG by multiplying the ethanol concentration in blood (g/L) by 22. All osmotically active substances are metabolized to acids and their anions then increase the AG (see above Introduction to acid-base disturbances).
When intoxication is suspected, we very often indicate an orientation test for frequently abused substances in the urine. This is a set of parameters that usually includes the determination of amphetamines/methamphetamines, tetrahydrocannabinoids, opiates, cocaine, benzodiazepines, but also barbiturates, tricyclic antidepressants or ecstasy. The exact composition varies according to local prevalence and needs. It is important to note that this is an indicative determination based on group immunochemical reactions - the antibody used may react with various similar molecules, with their metabolites; the determination is therefore not specific. Also, the determination of the decision limit when we give a positive or negative result has no precise rules and even a negative result does not mean that the patient has not ingested the suspected nox. Add to this the uncertainty caused by the frequent efforts of patients to achieve a negative result (e.g., by ingesting large amounts of fluid and subsequent dilution of urine or various interfering additives) and the usually low correlation between the finding of positivity in the urine and clinical status. Therefore, the decision on diagnosis or therapy must be based on complex anamnestic and clinical information with support from a landmark toxicological examination.
3.8. List of abbreviations used
ABR acid-base balance
ACE angiotensin converting enzyme
ACEI ACE inhibitors
ACR urine albumin/creatinine ratio
ADH antidiuretic hormone
AIM acute myocardial infarction
ALP alkaline phosphatase
ALT alanine aminotransferase
ARB angiotensin receptor blockers
AST aspartate aminotransferase
BNP B-type natriuretic peptide
CK creatine kinase
CRP C-reactive protein
cTn cardiac troponin, cTnT and cTnI - cardiac troponin T and I
CTV total body water
EBM evidence based medicine
ECT extracellular fluid
FN false negative
FP false positive
GGT gammaglutamyltransferase
ICT intracellular fluid
MAc metabolic acidosis
MAl metabolic alkalosis
NAFLD non-alcoholic fatty liver disease
NPV negative predictive value of the test
NT-proBNP N-terminal propeptide BNP
OG osmolal gap
PCT procalcitonin
PPV positive predictive value of the test
PT prothrombin time
RAAS renin-angiotensin-aldosterone system
RAc respiratory acidosis
RAl respiratory alkalosis
RCV reference change value, critical difference
RR reference range
RTC renal tubular cells
SIAD syndrome of inadequate antidiuresis
SN correctly negative
SP correctly positive
TSH thyroid stimulating hormone
4. Literature
- Marshall, W. J., & Bangert, S. K. Clinical Biochemistry: Metabolic and Clinical Aspects (2nd ed.). Churchill Livingstone; 2008.
- Beckett GJ, Ashby P, Rae P, Walker SW. Lecture Notes: Clinical Biochemistry [Internet]. 9th ed. John Wiley & Sons, Incorporated; 2013
- Pandey, Chandra Kant Dr., Singh RBD. Clinical practice guideline on diagnosis and treatment of hyponatraemia. Nephrol Dial Transpl. Oxford University Press; 2014;29(Suppl. 2):ii1-ii39.
- Seifter JL, Chang H-Y. Disorders of Acid-Base Balance: New Perspectives. Kidney Dis. Karger Publishers; 2016;2(4):170–86.
- Kidney Disease: Improving Global Outcomes (KDIGO) CKD Work Group. KDIGO 2012 Clinical Practice Guideline for the Evaluation and Management of Chronic Kidney Disease. Kideny Int. Suppl. 201(3):1–150.
- Malakouti M, Kataria A, Ali SK, Schenker S. Elevated Liver Enzymes in Asymptomatic Patients – What Should I Do? J Clin Transl Hepatol; 2017;5(4):1–10.
- Thygesen K, Alpert JS, Jaffe AS, Chaitman BR, Bax JJ, Morrow DA, et al. Fourth Universal Definition of Myocardial Infarction (2018). J Am Coll Cardiol; 2019; 40(3): 237–269.