Clinical biochemistry
2. Interpretation of laboratory data
The indication and interpretation of laboratory tests are among the daily tasks of physicians in almost all disciplines. The automation of most laboratory methods allows the determination of many markers in a short time, but only targeted indication and critical interpretation of the results can lead to benefits for the patient. In asymptomatic patients, laboratory testing is indicated rarely in screening for common and serious diseases (see below): e.g., lipidogram to determine the risk of atherosclerosis or occult bleeding in colorectal cancer screening. In other cases, the laboratory test should be indicated in a targeted manner - only on the basis of clinical examination and suspicion of a specific disease or group of diseases. Interpretation of results must be based on an understanding of the concept of reference ranges, decision limits and the clinical characteristics of the marker. Clinical use of any marker should only follow when sufficient evidence of its benefit to the patient's fate is available (evidence-based medicine, EBM).
Causes of changes in laboratory result values
The idea that the laboratory result changes only due to the disease of interest is incorrect. There are many other factors that contribute to its variability (Figure 1). Other diseases can also alter the result (the marker is not specific for the disease of interest), and considerable variance in results can be caused by biological variability.Intraindividual biological variability is variation in results in the same healthy individual - it reflects physiological regulation and adaptations.Intraindividual biological variability is the variation in marker values between healthy individuals - it reflects differences in body composition, genetic determinants, lifestyle and other factors. In addition to pathological and physiological influences, the entire information process from indication through the preanalytical phase, analytical phase, and postanalytical phase determines the value of the result and its interpretation (Figure 1).
Figure 1. Influences determining what value of the laboratory result we measure.

Let's briefly describe what happens in each phase and what errors can occur.
Indications for laboratory testing
It is based on clinical considerations about the likelihood of the disease before the test is performed and how the result may change the likelihood of diagnosis or management of the patient. The indication of an unjustifiably large number of determinations leads to an increase in the number of values that are outside the reference range (see below). For example, screening blood counts in asymptomatic patients leads to the detection of some value outside the reference range in 11% of patients: none of the patients has a serious disease, further investigation is not beneficial for the patient and unnecessarily stigmatises them and burdens the health system financially. If a physician forgets to indicate an important determination, he may not diagnose a serious disease. This is the most common error that leads to patient harm. Laboratory tests are ordered using a request form, nowadays most often in electronic form (Figure 2). All available laboratory tests and a commentary on their indication, collection and interpretation are presented by each laboratory in the form of a laboratory manual and usually available on a website.

Preanalytical phase
It includes preparation of the patient for the examination, sample collection and transport. In general, this is the stage where most mistakes are made: the patient does not follow the instructions for preparation before the examination (see below), the nurse does not correctly collect the biological material (at the right time, using the right technique, in the right and correctly labelled tube) or the sample is incorrectly transported (late arrival at the laboratory, sample degradation ...) or received in the laboratory (wrong label applied ...).
Analytical phase
It includes the actual determination of the marker; random error and systematic error contribute to the variability of the result.Random error reflects randomly distributed effects during the analytical process - e.g. random inaccuracies in pipetting sample volume and reagents, detector sensitivity, interference, etc. The most common interferents - haemolysis, ictericity and chylositivity - are routinely measured by modern analysers, so it is possible to verify the quality of the measured biological material in this way. Random error is most often expressed as imprecision - when comparing the result with the shot on the target, it is a measure of the scatter of individual shots (Figure 3).

Post-analytical phase
It mainly involves the transfer of results from the analyzer to the clinical information system: to the referring physician or directly to the patient; and the interpretation itself. During the transfer of results, there may be incorrect manual entry of results (e.g. when reporting results by telephone), confusion of units or incorrect assignment of results to another patient. Correct interpretation is always based on the clinical picture of the patient and a detailed knowledge of the correct use - advantages and disadvantages of the marker.
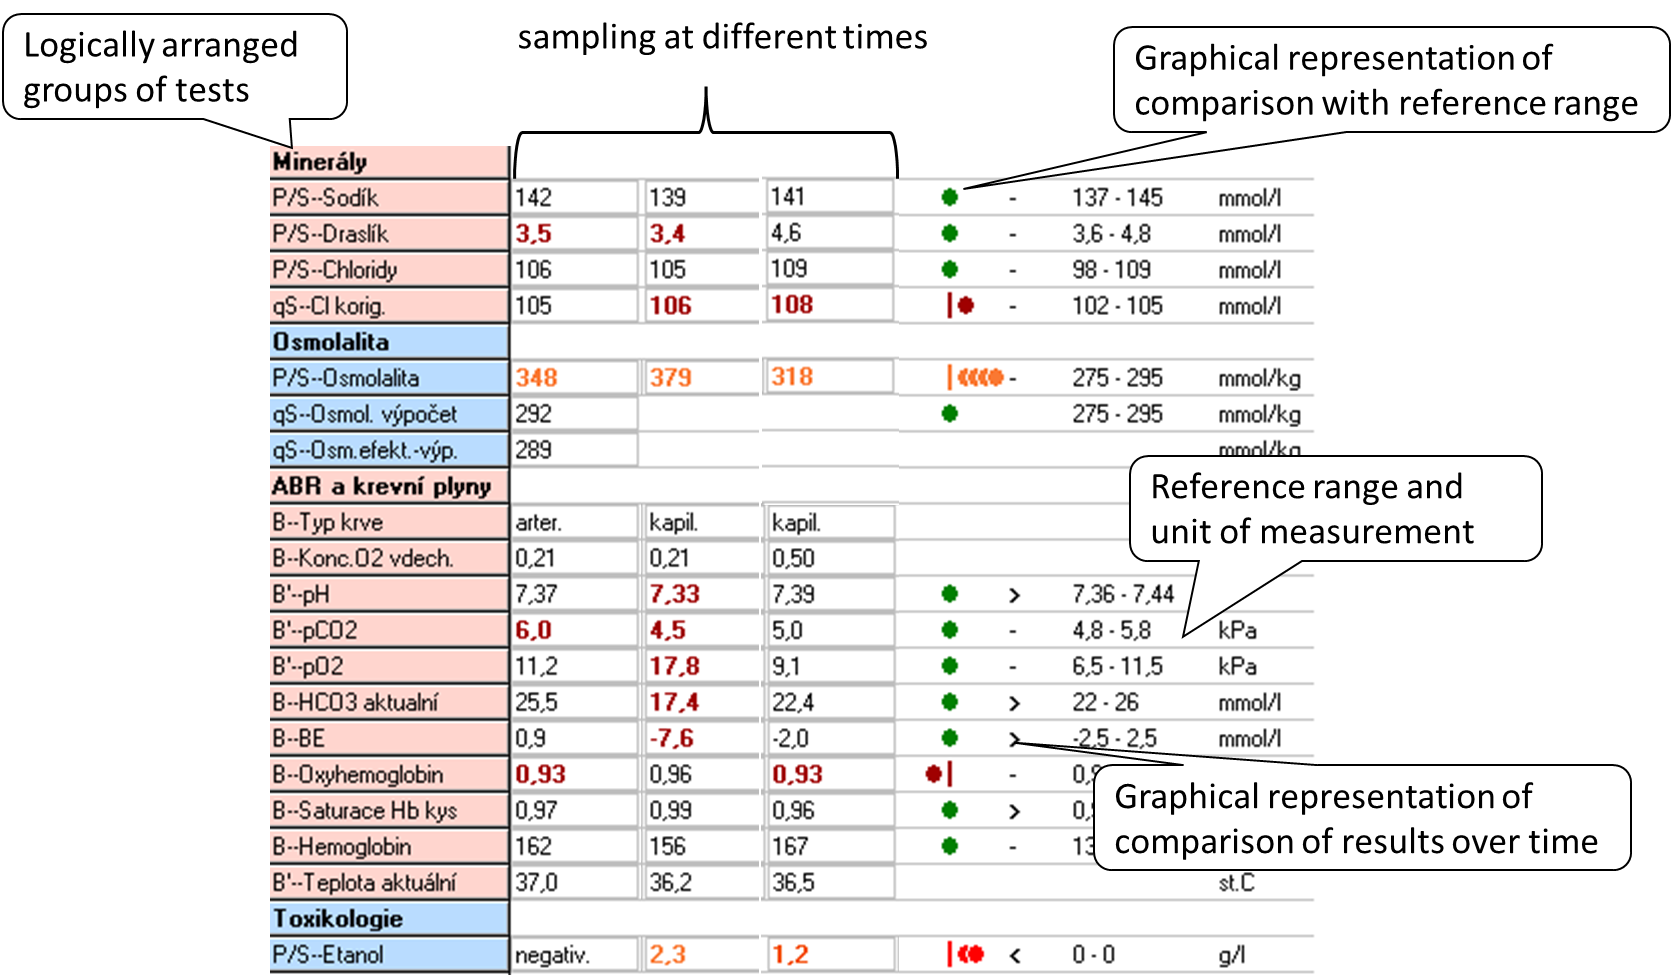
When interpreting the result, we most often use two principles: comparing the result with the reference range and comparing the evolution of the values over time.The reference range (RR) is determined by the biological variability of the marker: it includes 95% of the values of the results in the reference population, always 2.5% of the lowest and 2.5% of the highest values of the reference population are outside the reference range. Thus, in a simplistic way, we can say that 5% of the healthy population will have results outside the reference range. The reference population is composed of reference individuals who are "healthy" or at least do not have the disease that the marker affects. Health in this context can be confirmed in many ways: e.g., by questionnaire alone, by medical history, subjectively; or by physical examination, imaging, and other laboratory tests. When selecting a reference population, it is optimal to choose one that is closest to the clinical use of the marker. Figure 4 shows an example of a laboratory results sheet, including a demonstration of how the results compare to the reference range and how they have evolved over time. If the marker values are relatively stable within a single healthy individual (low intraindividual variability) and there are significant differences between healthy individuals (high interindividual variability), the reference range is relatively wide - it must cover interindividual variability. Comparison of the measured result with the RR may then not be sensitive enough to detect pathological changes in an individual and it is better to compare the evolution of values over time. Such markers are, for example, serum creatinine or cardiac troponin.
Diagnostic properties of the method, decision limit
The concept of reference range is only statistical, it is not directly related to the presence or absence of disease. Therefore, we relatively often introduce decision limits (cut-offs) - values at which we already decide, for example, to assign or exclude a diagnosis, to change treatment. When we use the decision limit for diagnosis, it divides the population under investigation into those with a positive and negative test result (Figure 5). Therefore, some patients with a positive test result will not have the disease (false positive result, FP) and some patients with a negative test result will have the disease (false negative result, FN).
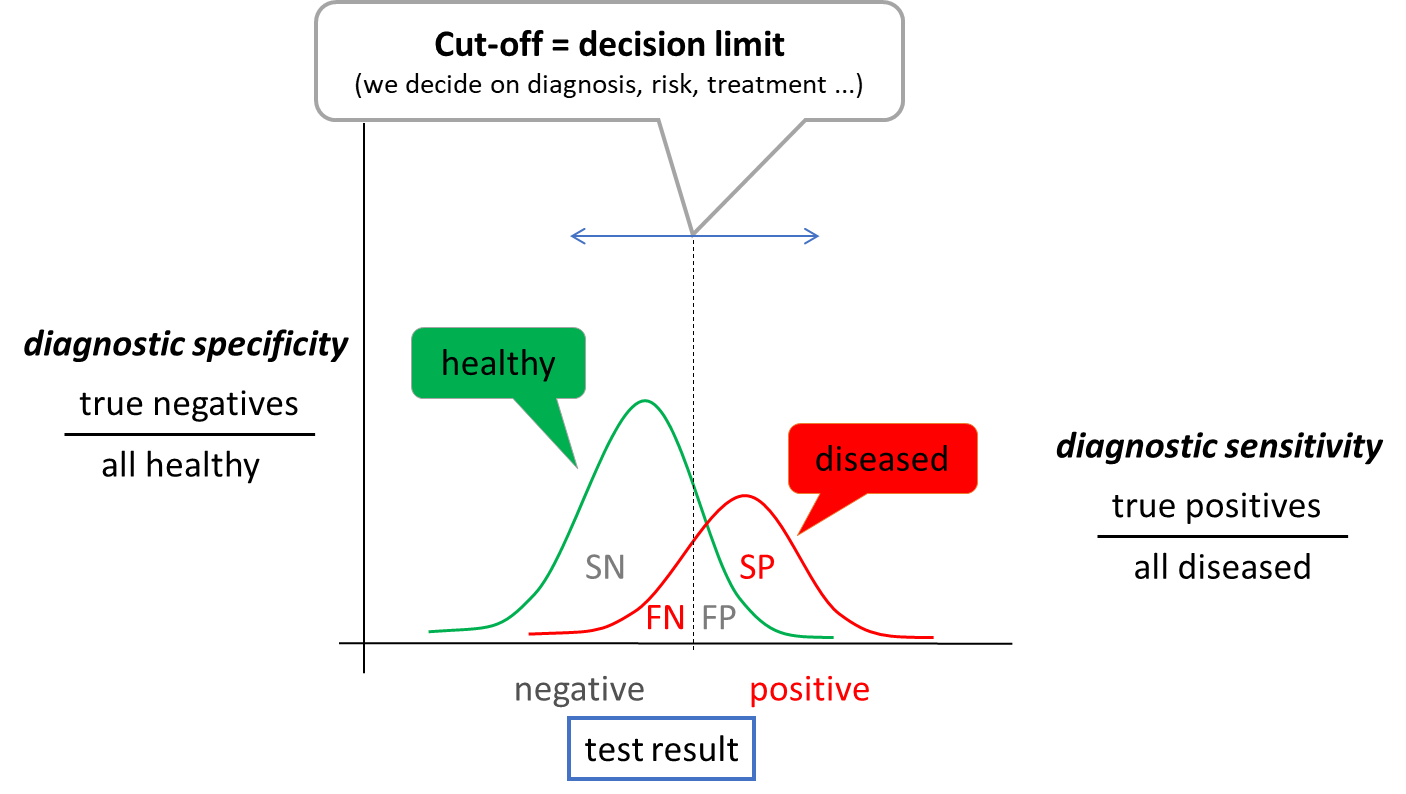
When determining the optimal cut-off value, it is useful to evaluate the ratio between the test correctly classified patients (correctly positive, SP) and all patients (SP + FN) - diagnostic sensitivity and the ratio between the test correctly classified healthy (correctly negative, SN) and all healthy (SN + FP) - diagnostic specificity. Due to the partial overlap of test result between healthy and diseased population, an increase in sensitivity always leads to a decrease in specificity and vice versa. The choice of the optimal decision limit is therefore determined by clinical needs - sometimes we prefer sensitivity: to catch all sick people, sometimes we prefer specificity: not to unnecessarily label a healthy person as sick. Diagnostic sensitivity and specificity are poorly applicable to a particular patient outcome. Therefore, we use other expressions - negative and positive predictive value (NPV and PPV). NPV is calculated as SN/all negative results and PPV as SP/all positive results. Thus, they express the probability with which the patient is healthy when the test result is negative (NPV) or with which probability the disease of interest is present when the test result is positive. For example, if we measure a very low to unmeasurable cardiac troponin value in a patient with chest pain (see below), we have a high probability that the patient does not have an acute myocardial infarction. The test has a high NPV.
Uncertainty of outcome
All of the sources of variability in the laboratory result summarized in Figure 1 lead to the necessary uncertainty surrounding the laboratory test result. This is true even when all steps are performed optimally. From this principle comes a view of comparing results over time called critical difference or also reference change value (RCV). The latter takes into account variability due to analytical imprecision and intra-individual variability, and mathematically expresses the interval within which values must fall for the variability to be due to imprecision and biological variability alone with a 95% probability. Thus, if the RCV for cardiac troponin is 50%, then if we measure a value of 100 ng/L and 120 ng/L in 12 hours, the two values are not significantly different. They would only be different if they exceeded 100 +/- 50 ng/L. The RCV principle cannot be taken absolutely, but it can help us in interpreting the results and illustrates well that the idea of a laboratory result as a single point (number) is wrong. Rather, a laboratory result is an interval of possible values, the width of which is determined by all the uncertainties surrounding it, or which we are able to quantify and account for.
Screening and selected screening programmes
In the introduction, we stated that laboratory tests are indicated only on the basis of clinical suspicion. Exceptions to this rule are screening programs, where we try to common, severe and effectively treatable diseases in the asymptomatic or oligosymptomatic stage. Depending on the set-up, we speak of population screening - we screen all individuals (e.g. over 40 years) or selective screening - we screen only individuals at risk (e.g. Screening can be done by physical examination (e.g. per rectum examination), imaging (e.g. mammography) or laboratory tests. The clinical characteristics of the screening test are individually adjusted according to the effect on the population being screened - the benefit of screening for the patient must be clearly demonstrated. Therefore, when planning any screening programme, careful consideration must be given to how many people will be included in the programme; how many of them will have the disease of interest (what is the prevalence) - how many will have a positive test result (true positive test result) and how many will have a negative test result (false negative test result); how many healthy people will have a positive test result (false positive test result); and what the next course of action will be if a positive result is found. Inappropriately chosen screening programmes can paradoxically lead to increased patient mortality - e.g. because the test itself or the subsequent management of patients with a positive result has its own risks.
As an example of population screening let us mention screening of colorectal cancer by quantitative measurement of hemoglobin in stool. All patients aged 50 years and older are enrolled - if every year for the next 5 years the test result is negative, the interval is extended to every 2 years in the following years. Alternatively, a primary colonoscopy can be performed at any time and the interval for the next test is extended to 10 years. A positive stool haemoglobin result is followed by colonoscopy. Another example is the screening for dyslipidemia, which should be considered in all individuals aged 19, 30 and 40 years; ev only in men over 40 years and in all women over 50 years and in all at-risk patients. The basic test here is LDL cholesterol. Hypothyroidism screening is an example of selective screening - we screen, for example, pregnant women in the first trimester or when there are problems with getting pregnant before conception. The test for congenital hypothyroidism is part of the newborn screening. In both cases, the basic test is the examination of thyroid stimulating hormone (TSH), if its level is elevated, we add other tests (e.g. free hormone fraction T4 ev. and T3, autoantibodies) to determine the etiology of the disease. Similarly, screening for celiac disease is selective - antibodies to transglutaminase and we only screen for total IgA in at-risk populations, e.g., patients with autoimmune diseases such as type 1 diabetes, patients with fatigue syndrome, depression, skin diseases, or unexplained ALT elevations.
Screening does not include laboratory test kits, which are usually indicated at the time of admission or at the first contact in the outpatient clinic. The use of these groups of examinations is not recommended, rather it leads to unnecessary indications and to omission of essential examinations - unless the indication is supported by critical clinical reasoning.
Blood and urine collection
Correct collection of biological material is very important for a good laboratory result. The following procedure should be followed for blood collection: (1) identify the patient and verify that the patient is properly prepared (fasting ...), (2) prepare the necessary equipment and tubes, (3) label the tube with the patient's label; it is important to perform this step in presence of the patient as a prevention of sample confusion, (4) put on gloves, (5) apply the tourniquet, (6) select the venepuncture site and disinfect it, (7) perform the venepuncture and fill the first tube, (8) release the tourniquet, (9) gently invert the tube back and forth once (mix), (10) fill the other tubes and gently invert each once, (11) remove the needle from the vein and dispose of it in the appropriate waste, (12) treat the venepuncture site and instruct the patient to apply pressure to the venepuncture site for the next 5 to 10 minutes and not to flex the arm, (13) gently invert each tube 4 more times, (14) remove gloves. Blood sampling is an activity where errors occur frequently, so it is advisable to insist on the optimal procedure and check it regularly. The most common errors associated with blood collection include haemolysis, poor tube selection and patient mix-up. Thus, we should also mention correct tube selection - each examination requires a specific type of material. The most common collection tubes include the following:
- red - without additives (or only with a clotting accelerator); provides clotting blood, which is centrifuged to obtain serum; suitable for most biochemical analyses, the disadvantage is the possible delayed clotting of the sample in the device (e.g. in anticoagulated patients)
- green - with the anti-clotting additive lithium heparinate; provides non-clotting blood, which is centrifuged to obtain plasma; used as red tubes
- purple - with the anti-clotting additive K3EDTA; provides non-clotting blood, most commonly used for blood count testing
- blue - with sodium citrate, an anti-clotting additive; provides non-clotting blood, most commonly used for testing coagulation parameters
Sampling for acid-base balance must be done anaerobically, otherwise air bubbles will affect the partial pressures O2 (rise) and CO2 (fall).
Urin is one of the easiest biological materials to obtain and its examination provides valuable information. Most errors that can completely invalidate the result of the examination are found in the way the sample is collected, its storage and failure to observe the maximum time to analysis. The following list summarises the basic types of samples used clinically:
- first morning urine - most commonly used for basic urine chemistry and urinary sediment testing. The concentration of the analytes measured is relatively high, we have the best chance of catching pathology. The disadvantage is usually the long time from collection to analysis, which leads to artifactual changes in urine composition: if urea-degrading bacteria are present, pH rises; glucose drops by bacterial decomposition; ketone bodies evaporate; bilirubin decomposes in the light; cells and cylinders break down; crystals may form and disappear. Therefore, for chemical examination and microscopic examination of urine, we usually prefer a random sample.
- second morning urine and random urine sample - both types of samples are similar in composition; for the second morning urine we only emphasize that it is the first sample produced by the kidneys in the upright position (not in sleep) and is sometimes recommended in the standardization of albuminuria testing (see below).
- short collection (e.g. 4 hours) - most commonly used for fractional excretion testing (see below). In patients without a urinary catheter, the composition corresponds to a random sample; in catheterized patients, the spout must be pinched for 4 hours.
- Collecting 24 hours - the recommended procedure is as follows:
- the patient wakes up in the morning and urinates outside the collection container
- from then on he collects all his urine in a prepared container (or more containers)
- the next morning, after waking up (exactly 24 hours later), he still urinates in the collection container
- The next step is to mix the entire volume of collected urine (if there are several containers, it is necessary to pour them into one large one), measure the volume of urine (to the nearest 100 ml) and take a representative sample.
Tests that require collection of urine (e.g. creatinine clearance) are currently being moved away from, as collection is often burdened by large errors (incomplete collection, poor mixing of the sample, inaccurate measurement of sample volume...) and is uncomfortable for patients. Therefore, if there is a relatively reliable alternative without urine collection, we prefer it.
"Non-collected" (single-use) urine samples are generally collected after careful genital cleansing as part of routine hygiene, with a midstream of urine (at least 2-3 s from the start of urination). In women during menstruation, a correct sample cannot be collected without catheterization.
For each individual urinary analyte, it is advisable to observe the time from sample collection to the actual analysis. If this cannot be met (e.g. timely transport of the sample to the laboratory cannot be ensured), preservatives can sometimes help to extend this time. The simplest and most common preservation measure is cold and darkness, i.e. refrigeration. Refrigeration will prevent significant bacterial growth for approximately 24 hours. The sample must be allowed to come to room temperature before actual analysis, otherwise the sediment may contain precipitated amorphous phosphates and urates, and increased specific gravity. Chemical preservatives are usually only suitable for one or a few analyses and may interfere with other determinations and are more likely to be used in specific applications. There are commercially available tubes which (depending on the manufacturer) can provide reliable sample preservation for up to 72 hours (at room temperature).